Fundamental Analysis of EUR/USD Ahead of the Fed Meeting (January 29, 2025)
Publication Date: January 22, 2025
The next Fed meeting will take place on January 29, 2025, and according to current market expectations, the probability of maintaining the interest rate at 4.5% is 97%. This assumption is based on data from the 30-day federal funds rate, which indicates no changes in US monetary policy.
According to our fundamental model, the current calculated EUR/USD rate is 1.0524 (and until March 31, the calculated rate is 1.07), which is slightly above the current market levels shown on the chart. The actual price is lower than the calculated rate, therefore, there is potential for growth.
Key Macroeconomic Indicators:
- Federal Funds Rate: 4.5%.
- ECB Rate: 3.15%.
- US Inflation: 2.9%.
- Eurozone Inflation: 2.4%.
- US GDP Growth: 3.1%.
- Eurozone GDP Growth: 0.4%.
- US Unemployment: 4.1%.
- Eurozone Unemployment: 6.3%.
- Speculative Positions: -60.4.
In light of these factors, limited volatility in the EUR/USD market can be expected until the announcement of the Fed's decision, as most fundamental drivers are already factored into current prices.
Technical Analysis
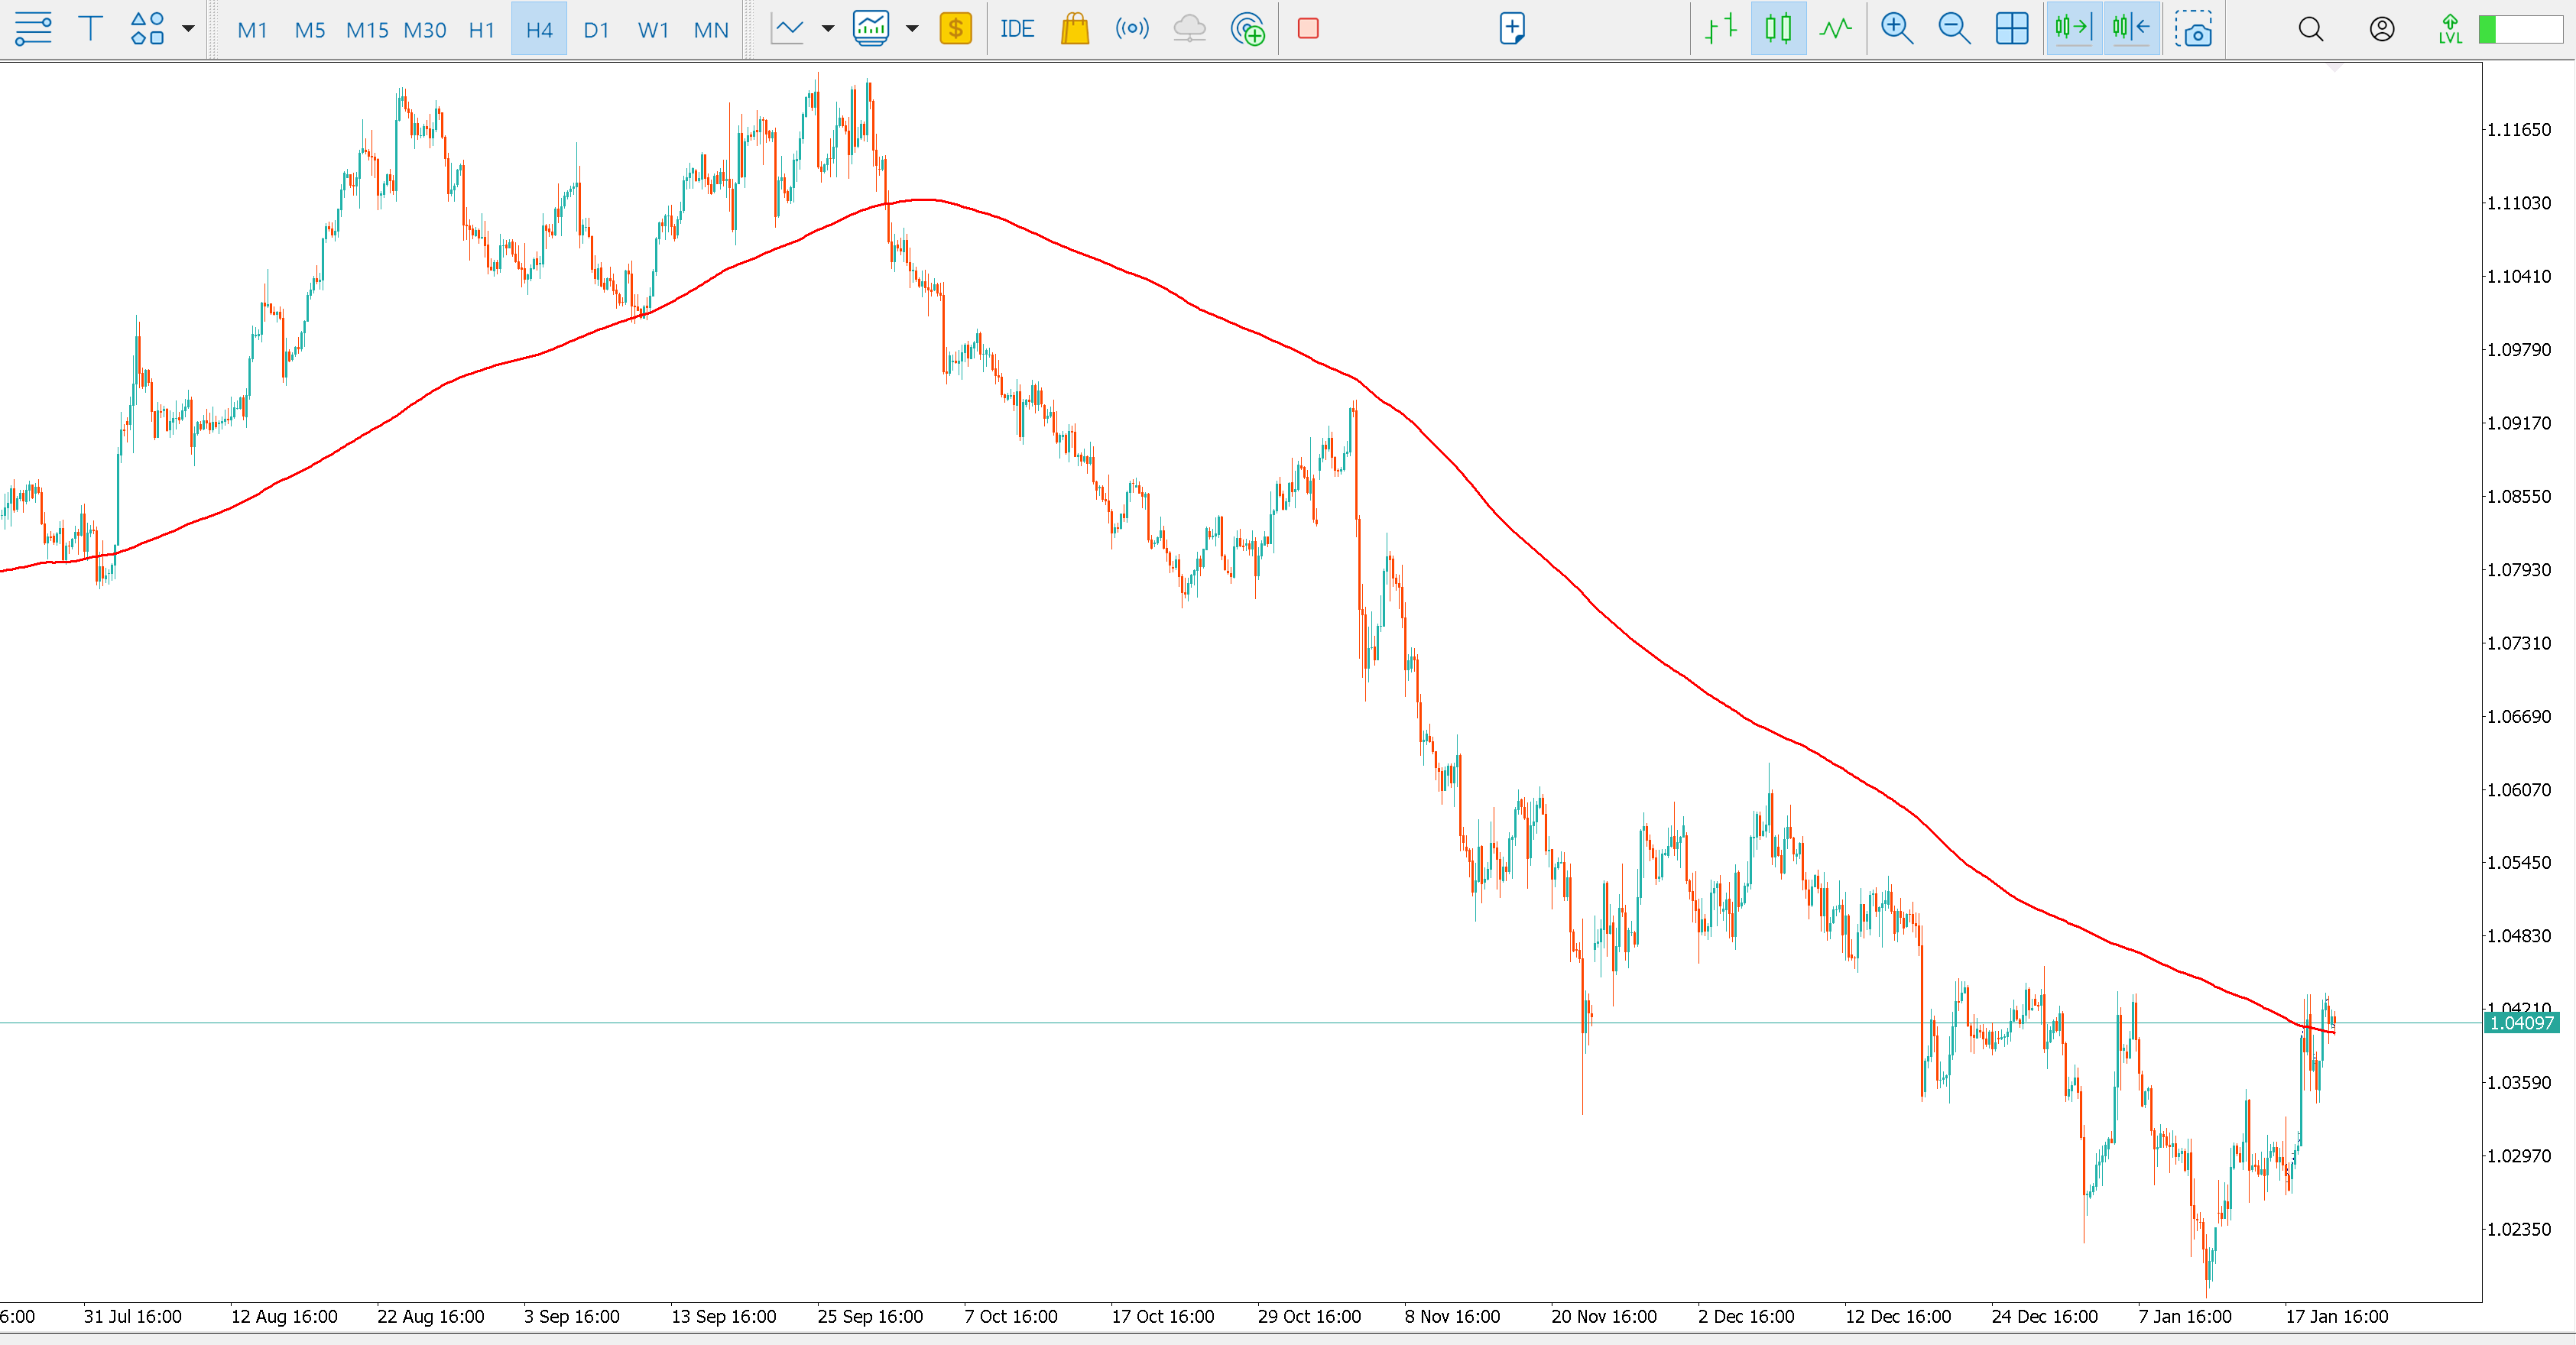
On the EUR/USD chart with the H4 (4-hour) timeframe, a long-term downward trend is clearly visible, which began to form in mid-2024. However, the current dynamics demonstrate an attempt at a reversal or at least a corrective growth.
Key Points:
- 200-period SMA (red line):
- The moving average continues to play the role of dynamic resistance. The price is approaching this line and has already tested it several times. If a strong breakout occurs, it will be a signal for a possible trend reversal.
- Series of Rising Lows:
- Since mid-January, a sequence of higher local lows has been observed, which may indicate the beginning of the formation of an upward trend.
- Current Price Relative to the Calculated Price:
- The price on the chart (around 1.0410) is gradually moving towards the level determined by our fundamental model (1.0524). This confirms the consistency of market dynamics with the calculated value and strengthens the likelihood of further growth.
- Long-Term Downward Trend:
- Despite the current correction, the chart shows that the previous trend was clearly downward, with a series of consecutive lower highs. If the price can consolidate above the 200-period SMA, this will be an important indicator of a change in market dynamics.
- Key Levels:
- Support: 1.0350 – the nearest level below which the price is likely to encounter strong demand.
- Resistance: 1.0500 – an important psychological level that coincides with the calculated price. A breakout of this level will pave the way for a move towards 1.0600 and above.
Conclusion
The current technical picture confirms the price movement towards the calculated level proposed by our fundamental model. The testing and potential breakout of the 200-period moving average will increase the likelihood of a continued rise in the EUR/USD exchange rate.